OverviewMany people think that the term “mean” means the same thing as “average.” It doesn't. The term mean is a mathematical term, whereas the term average is often used loosely as a description for a person or a data item. In mathematics,
average is
a number that typifies a set of numbers of which it is a function.
In other words, average can stand for
mean,
median, or
mode. So what is the difference between these three terms?
- Median - is the middle value in a set of numbers; above and below which lie an equal number of other values.
- Mean - is a number that typifies a set of numbers, such as a geometric or arithmetic mean; it is what most people think of as being the average value of a set of numbers.
- Mode - is the value or item that occurs most frequently in a set of statistical data.
Look at the following two sets of data:
Example set 1: 15 16 17 17 17 18 19Analyzing this first set of data, representing the ages of the seven students in a school who enjoy drama, I get:
- Mean Age = 17
- Median Age = 17
- Modal Age = 17
Example set 2: 15 17 17 17 21 29 52Analyzing this second set of data, representing the ages of the seven night school students who enjoy drama, I get:
- Mean Age = 24
- Median Age = 17
- Modal Age = 17
As you can see, the median age and the modal age for both sets of students are the same, whereas the mean age is completely different. Which
average you choose will determine whether you consider the average age for students who enjoy drama to be the same for both normal schools and night schools. If statistics (mathematics is my major by the way) taught me nothing else, they showed me that there is no such thing as an average.
So let's move on to Discoverer and let me show you how to create the calculations that will enable you to report the Median and the Mode. I won't discuss Mean here because this is what Discoverer and everyone else generally refers to as the Average. As you know, Discoverer has a built-in function (AVG) to handle this.
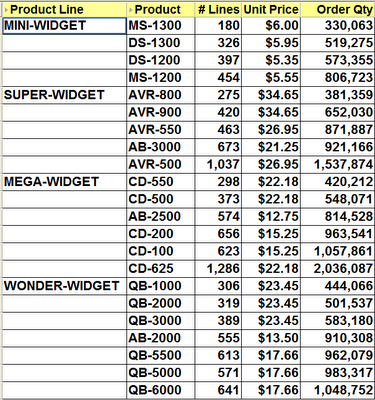
The base worksheet:
As usual, I will start with a base query drawn from my own tutorial database. As you can see below, this worksheet displays a count of the number of lines, the unit price and the total number ordered for each product against each product line. There is a group sort on the Product Line and a low to high sort on the Order Qty.
Creating the Median
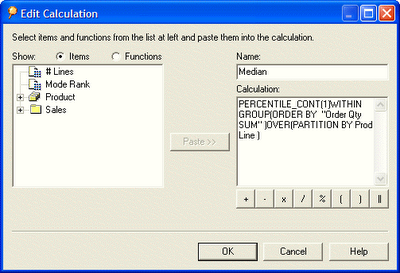
The calculation that you will need for the Median is the PERCENTILE_CONT analytic function. The basic syntax of this function is:
PERCENTILE_CONT(n) WITHIN GROUP(ORDER BY expr1)
OVER(PARTITION BY expr2)
Looking at my base query above let's figure out some values for expr1 and expr2, then I will discuss the appropriate values for n.
First of all, the easy one - the PARTITION BY. Looking at the example worksheet above I can see that I have a group sort on the Product Line. Because I know that page items and group sorted items are normally the partitioned items I will use the Product Line for expr2.
Next, let's determine a value for expr1 - the ORDER BY. Once again, look at the example worksheet. I only have two sorts in my worksheet. The first is a group sort on the Product Line and the second a low to high sort on the Order Qty. However, my Product Line has already been handled because it is my partitioned item. Therefore, the most logical item for me to use in my ORDER BY clause is the Order Qty, which is what I did.
Note: the underlying aggregation for my Order Qty is SUM so it is very imported to select the Order Qty SUM and not Order Qty itself.
Finally, let's discuss n - the value provided to PERCENTILE_CONT. This is a value from 0 to 1 with the value indicating how far along a scale from 0% to 100% I want the value to be. Because the definition of Median is the midle value, it therefore makes sense to choose 0.5 or 50%.
Putting all of this together, here is my calculation:
PERCENTILE_CONT(0.5) WITHIN GROUP(ORDER BY Order Qty SUM)
OVER(PARTITION BY Prod Line)
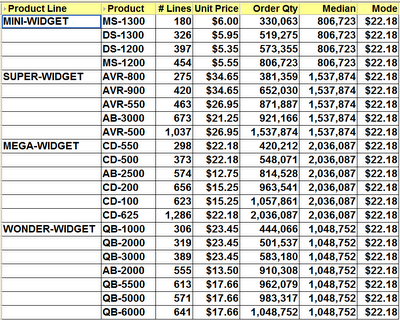
which when inserted into a Discoverer calculation makes my worksheet look like this:
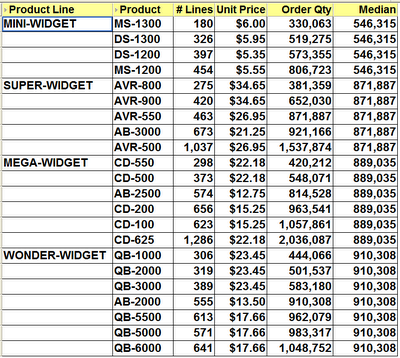 Note: because there are an even number of values for MINI-WIDGET and MEGA-WIDGET, Discoverer will choose a value exactly half-way between the two middle items in the set. When there is an odd number of values, Discoverer will always choose the actual middle item, as you can see if you look at the Median for SUPER-WIDGET and WONDER-WIDGET.
Using 0 and 1 in PERCENTILE_CONT
If you use 0, for 0%, as the value for n in the PERCENTILE_CONT calculation this means you want Discoverer to display the first value, wheras if you use 1, for 100%, this means you want to see the last value.
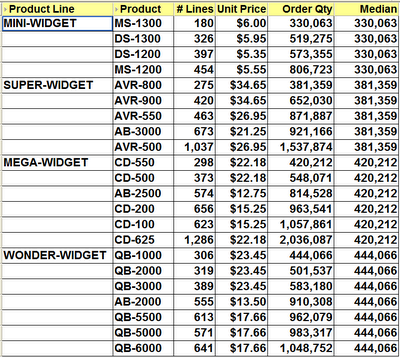
Here is an example using 0:
PERCENTILE_CONT(0) WITHIN GROUP(ORDER BY Order Qty SUM)
OVER(PARTITION BY Prod Line)
 Here is an example using 1:
PERCENTILE_CONT(1) WITHIN GROUP(ORDER BY Order Qty SUM)
OVER(PARTITION BY Prod Line)

Here is what this last calculation looks like inside Desktop:
 Creating the Mode
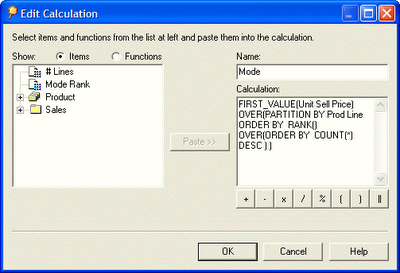
The calculation that you will need for the Median is the FIRST_VALUE analytic function, couple with the RANK function. The basic syntax of this combined function is:
FIRST_VALUE(expr1) OVER(PARTITION BY expr2
ORDER BY RANK() OVER (ORDER BY COUNT(*) DESC))
Hopefully, you can see what is going on. Starting from the inner function, the RANK, all this does is count the number of rows, which in our database happens to be the same as the number of lines, and produce a ranking in descending order with the highest count being 1, the next highest being 2 and so on. Because this ranking is embedded within the main function there is no possibility of a user accidentally deleting this calculation.
This whole RANK function then becomes the ORDER BY clause of the main function. Thus, I only need to find values for the two expressions, expr1 and expr2.
First of all, the easy one - the PARTITION BY. Looking at the example worksheet above, once again I can see that I have a group sort on the Product Line. As mentioned earlier, because page items and group sorted items are the partitioned items I will use the Product Line for expr2.
Finally, let's discuss expr1, the value which will be used for the basis of FIRST_VALUE. This is the item that I want to base the Mode on. In my case, I have chosen to use the Unit Price.
Putting all of this together, here is my calculation:
FIRST_VALUE(Unit Price) OVER(PARTITION BY Product Line
ORDER BY RANK() OVER (ORDER BY COUNT(*) DESC))
which when inserted into a Discoverer calculation makes my worksheet look like this:
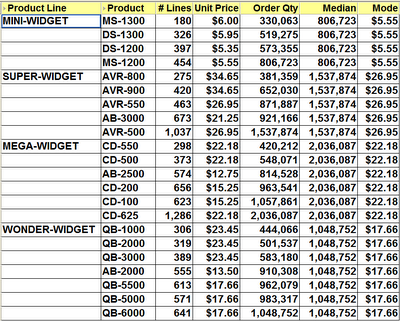 Note: as you can see the mode has been calculated for each group sorted item. Also, even though multiple products have the same unit price, this will still be taken into account. Look at the mode result for SUPER-WIDGET. Discoverer is telling me that the mode is $26.95. This is correct because Discoverer has added the number of lines for both AVR-500 and AVR-550 together, which accounst for more lines than any of the other products in that product line.
If you are interested, here is my calculation inside Desktop:
Extending the Mode
Take a look at the following calculation. You will see that I have altered it to remove the PARTITION BY clause.
FIRST_VALUE(Unit Price) OVER(
ORDER BY RANK() OVER (ORDER BY COUNT(*) DESC))
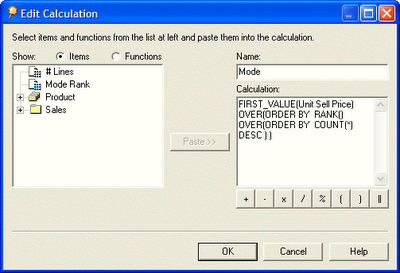 Becasue the PARTITION BY clause has been removed, the Mode now calculates on the whole set. Thus, as you can see below, I have now determined that $22.18 is the Unit Price that is most often used in my organization. This is obviously a price that my customers are willing to pay. Hey, maybe I ought to raise the prices on the lower priced items!