Overview
When a user drills up, Discoverer leaves the original item in situ, adds the drilled-up item to the query to the right of the original item, and leaves the number of rows the same.
When a user drills down, Discoverer removes the original item, replaces it with the drilled-down item, and increases the number of rows to accommodate the new situation.
Because a picture tells a thousand words, allow me to explain the above scenarios using sme images from my own system. First of all, I must have a start point. I will then take this base worksheet and first of all drill up from the quarter to the year, followed by drilling down from the quarter to the month:
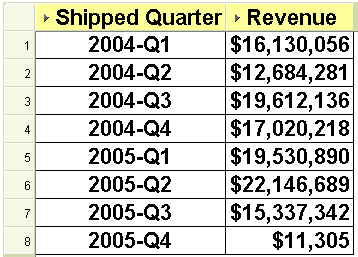
The base worksheet:

As you can see above, this worksheet displays my revenue by fiscal quarter for the fiscal years 2004 and 2005.
Note: for this demonstration, the fiscal year runs from October 1 to September 30.
Let's drill UP. When drilling up, the new item is added to the query rather than replacing the original, thus retaining the same number of rows. Interestingly the new (aka summary) drilled-to item is added to the right of the original item rather than to the left which is where it should be. This is all standard Discoverer functionality so please don't shoot the messenger. Personally, I think it would be better if Discoverer were to replace the original item with the drilled-up item and reduce the number of rows to summarize the data. Unfortunately, as you can see below, it does not:
The drilled-up worksheet:

Let's drill DOWN. When drilling down, the new item replaces the original item and Discoverer increases the number of rows to accommodate the new situation. In my opinion, this is also incorrect. I think it would have been better if Discoverer had retained the original item and added the drilled-down item to its right-hand side. This way I could easily add a group sort on the higher-level item with a sub-total on each break.
Here is Discoverer's method of drilling down:
The drilled-down worksheet:

And here is the way that Discoverer could look if the drilled-from item had not been replaced:
The ideal drilled-down worksheet:
Of course, I know you can always edit the worksheet and add back in the item that was removed, which is exactly what I did above.


2 comments:
Hi Michael;
Is there are way in which we can plot only the Revenue for the Shipped Quarter in the graph even though we have fully drilled value(drilled down to month) in the worksheet.
In the graph I just want to see values for quarter but want to see the detail at the same time in the worksheet.
Thanks,
Nidhi
Hi Nidhi
I'm afraid not. When you plot a graph in Discoverer all of the elements from the worksheet are included in the plot. What I do is to have a different worksheet in the same workbook that has only the elements needed for the plot. I can then use this to see my graph.
Does this help?
Regards Michael
Post a Comment