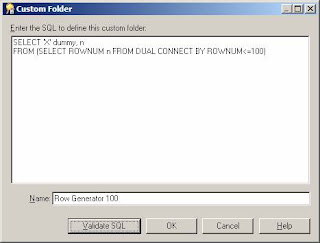
A folder that you can use as a row generator is always useful to have in an EUL. A row generator is just a folder that always returns a fixed number of rows. You can define a row generator either by using a database view or by creating a custom folder as shown below. There is a dummy item included in this row generator so that the folder can be joined to other folders in the EUL.
Lists of Values
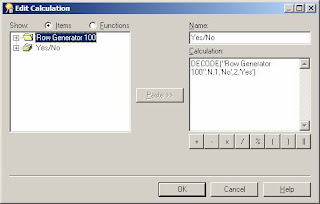
There are many uses for a row generator but they are often most useful when creating a list of values (LOV) where there are a fixed number of values, for example, a Yes/No list of values. To create you LOV first create a new (complex) folder, then drag the N item from the row generator folder into the new folder. You then need to create a mandatory condition in the new folder to restrict the number of rows, for example, in this case N<=2. You can then create a calculated item to return the text used in the LOV. You can use DECODE to convert the number into a text string as shown below.
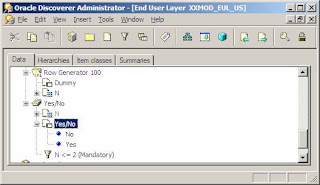
Then create a LOV item class based on the calculated item so that you have a folder that returns the required values as shown below.
Of course this is a very simple example. But in general you will find it easier to have one row generator folder and have complex folders for each LOV. It is easier to use a CASE or DECODE expression than create a new custom folder for each LOV.
Other useful examples are:
| List of Values | Calculation | Condition | |
| Days of the week | TO_CHAR(TRUNC(SYSDATE, 'D')+n-1, 'Day') | N<=7 | |
| Previous 12 months | ADD_MONTHS(TRUNC(SYSDATE, 'MONTH'), 1-n) | N<=12 | |
| Letters of the alphabet | CHR(65 + n-1) | N<=26 |
This last example where you have a LOV containing the letters of the alphabet is useful when you want to show an index on a text field, for example, bookname. You need to create a bookname_char calculated item, UPPER(SUBSTR(bookname,1,1)) and put this in the alphabet item class. You then need to create a hierarchy from the bookname_char item to the bookname item which will let you select the first letter of the bookname and then drill down to see all names beginning with this letter.
Fixing the number of columns
The row generator is also useful if you need to have a fixed number of columns in a crosstab report. For example you wanted 12 columns, one for each month in the year summarising employee earnings. Now, there will be some employees who do not have earnings for all months in the year. When the report is run for these employees there will be less than 12 columns. If you create a LOV folder for the months you need as described above and outer join the LOV folder to the report folder then you will always get a fixed number of columns in your report.
Pivoting
A row generator can be used to pivot a table or part of table. This is where you want to show values that are in different columns on separate rows.
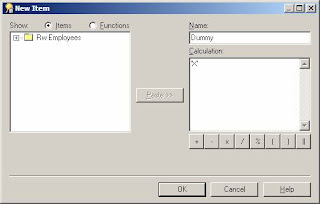
For example, if your employee table has columns for the hours worked on each day in the week and you need a report showing the total hours on each day of the week by department. So in this case you need to pivot the hours onto separate rows. You do this by creating a days of the week folder that always returns 7 rows as described above. Make sure you also include the dummy item from the row generator folder. Then create a dummy item in your employee folder as shown below.
You can then join the employee table to the days of the week folder using the dummy item. Then in the workbook create a calculation to show the total hours for any day using:
SUM(DECODE("Row Generator 100".N,
1, Employees.mon_hrs,
2, Employees.tue_hrs,
3, Employees.wed_hrs,
4, Employees.thu_hrs,
5, Employees.fri_hrs,
6, Employees.sat_hrs,
7, Employees.sum_hrs))
You can then select the day from the days of the week folder, the department from the employees folder and the hours calculated item to get the sum of the hours for each day of the week.
Counting records many times
The row generator can be used to multiply rows when you want to count the rows several times.
For example, if you have a report that shows when users logged on and off your system but you want a chart showing the how many users are logged on during each hour during the day. This means that if there is a record showing user A logged on at 8am and logged off at 11:50am then this record needs to be counted 4 times, once for each hour the user was logged on.
You need to create an hours row generator folder as described above that returns the 24 hours in the day using an hours calculation shown below :
TO_CHAR(n-1,'fm09')
Now if the user logon and logoff times were held in a user_timings folder then you need to join the hours row generator folder to this folder using a dummy item as described in the previous section. This will multiple each row 24 times. Then a condition in the workbook can be used to return only the hours when the user was logged onto the system:
Hours BETWEEN TO_CHAR(TRUNC(logon, 'HH24'), 'HH24') AND TO_CHAR(TRUNC(logoff, 'HH24'), 'HH24')
You can then count the records and group sort on the hours calculation to return the data you need for the chart.
This of course assumes that all users log on and off on the same day. You would need a slightly more complex condition if users where able to logon and off on a different day.


1 comment:
Cool post - thanks Rod - helped a lot...
Post a Comment